Introduction
The Maverick Suite is a collection of precision trading tools built on Center of Gravity (COG) principles and Dow Theory. Designed for trend continuation trading - no reversals, no gambling.
Structure first. Entry second. Confluence always. Trade what IS, not what you hope will be.
What's in the Suite
MAV Oscillator
The foundation. Three modes for structure mapping, entry targeting, and directional bias. Based on Ehlers' COG with zero lag.
View Docs →Slingshot Pro
Multi-timeframe confluence tool. Candle fills show when LTF and HTF align. Your final check before entry.
View Docs →MAV RADAR
Automated scanner via Discord. Single TF, MTF, and Trinity scans across stocks, crypto, forex. With auto-generated charts.
View Docs →POC Ghost Levels Pro
Volume-based POC indicator. Naked POCs, value area, ongoing + secondary POC, mitigation tracking. LTF-Closes math beats native VP.
View Docs →Key Principles
No Reversals
Every reversal is a breakout, but 85% of reversals fail. Trade continuations only - bet with the trend until proven otherwise.
Top-Down Analysis
HTF defines direction. LTF provides entries. Strong trends on slower timeframes, bet with that trend on faster timeframes.
Context is Everything
A setup without macro context is meaningless. A pullback is meaningless without defining what has been broken.
Confluence Stacking
Stack your edge: SR levels, Fibonacci retracements, VWAPs, pivot alignment. More confluence = higher probability.
Installation
TradingView Indicators
MAV Oscillator and Slingshot Pro are TradingView indicators.
Open TradingView
Go to tradingview.com and open any chart.
Open Indicators
Click the "Indicators" button (fx icon) at the top of the chart.
Search for MAV
Search "MAV 2.0" or "Slingshot Pro" in the indicator search. Look for indicators by Meddymarkusvanhala.
Add to Chart
Click to add the indicator. It will appear as a separate pane below your price chart.
MAV RADAR (Discord)
MAV RADAR runs on a dedicated server and is accessed through Discord bot commands. No local installation required.
Join the Discord server to use MAV RADAR. All scans are run through bot commands and results are delivered directly to Discord.
Quick Start
Get up and running with the Maverick Suite in 5 minutes.
Recommended Setup
Chart Layout
- Price chart (candlesticks)
- MAV-T or MAV-E below price
- Slingshot Pro for confluence
Timeframes
- HTF Bias: Daily or Weekly
- Structure: 4H or Daily
- Entries: 1H or 4H
Basic Workflow
Check HTF Bias
Open Daily chart. Check MAV-HTF slope. UP = look for longs. DOWN = look for shorts.
Map Structure
On 4H, use MAV-T to identify pivot sequence. HH+HL = uptrend. LL+LH = downtrend.
Wait for Break
Price must break something: median, Donchian, SR level, VWAP. No break = no trade.
Entry on Pullback
After break, wait for first pullback. Check Slingshot Pro for confluence. Enter at HL (longs) or LH (shorts).
A random pivot is weak. A pullback after breaking something is strong. Context matters.
Overview
The MAV Oscillator is the core of the Maverick Suite. Built on Ehlers' Center of Gravity (COG) principles with optimized smoothing for clean structure analysis.
Why MAV?
Zero Lag
Unlike moving averages, COG finds the balance point of price with virtually no lag while maintaining smoothness.
No Artificial Limits
Unlike RSI or Stochastic, MAV has no upper/lower bounds. This allows accurate structure analysis without false "overbought/oversold" signals.
Clear Pivots
Pivots form on slope changes. Easy to label, easy to track sequences, easy to identify structure.
Three Modes
MAV-T for structure, MAV-E for entries, MAV-HTF for bias. Each optimized for its purpose.
The Three Modes
| Mode | Purpose | Best For | Characteristics |
|---|---|---|---|
| MAV-T | Structure | LTF structure mapping | Clean pivots, low noise, less divergence |
| MAV-E | Entry | All timeframes | Fast reaction, more pivots, more divergence |
| MAV-HTF | Bias | Daily+ ONLY | Macro trend, fast reaction, directional bias |
"The relationship between -T and -E is a sliding scale between prioritising structure and prioritising the visibility of entries. A 'one hand washes the other' pairing of tools."
MAV-T (Structure)
MAV-T is optimized for structure mapping. Use it to draw channels, connect pivots, and identify the overall trend architecture.
When to Use
- Drawing breakout lines on the oscillator
- Tracking channel structure
- Connecting pivot sequences (HH-HL or LL-LH)
- LTF structure mapping
Characteristics
- Smoother: Less reactive than MAV-E
- Cleaner pivots: Fewer false signals
- Less divergence: Focus is on structure, not divergence signals
- Better for drawing: Lines and channels are cleaner
MAV-T: Clean pivots at slope changes, ideal for structure mapping
MAV-E (Entry)
MAV-E is the "scope on a rifle" - optimized for precise entry targeting. More reactive, more pivots, more visibility of divergences.
When to Use
- Targeting precise entries
- Spotting divergences
- Fine-tuning entry timing on any timeframe
- When you need more detail than MAV-T provides
Characteristics
- More reactive: Faster response to price changes
- More pivots: Catches smaller swings
- More divergence: Better for spotting divergence signals
- Stretches price action: Makes small moves more visible
MAV-E: More pivots, faster reaction - "scope on a rifle" for entries
Use MAV-T to identify the structure, then switch to MAV-E when you're ready to time your entry precisely.
MAV-HTF (Bias)
MAV-HTF provides macro directional bias. It's a fast, reactive oscillator - use it on Daily+ timeframes only to determine whether you should be looking for longs or shorts.
MAV-HTF is fast and reactive by design. On lower timeframes it becomes too noisy. Use MAV-T or MAV-E for intraday charts.
When to Use
- Determining overall directional bias
- Daily, Weekly, Monthly charts
- Filtering out counter-trend trades
- First step in top-down analysis
Reading MAV-HTF
Sloping UP
Look for LONG setups only. Filter out short signals on LTF.
Sloping DOWN
Look for SHORT setups only. Filter out long signals on LTF.
MAV-HTF: Fast reaction for directional bias (Daily+ only - too fast for LTF)
Settings
MAV uses fixed, optimized settings. Do not modify these values - they have been carefully tuned for optimal performance.
Optimized Settings
MAV indicators use proprietary, optimized settings that have been carefully tuned for optimal performance. These settings are built into the indicators - no configuration required.
Simply add the indicator to your chart. All parameters are pre-configured for best results.
Pivot Detection
Pivots are automatically detected when the MAV slope changes direction. The indicator marks these pivots for easy structure analysis.
Pivot Classification
Pivots are the building blocks of structure. Learn to classify them correctly and the trend becomes obvious.
Pivot Types
HH - Higher High
A peak that's higher than the previous peak. Confirms uptrend continuation.
HL - Higher Low
A valley that's higher than the previous valley. Entry point in uptrends.
LL - Lower Low
A valley that's lower than the previous valley. Confirms downtrend continuation.
LH - Lower High
A peak that's lower than the previous peak. Entry point in downtrends.
Trend Identification
UPTREND
HH + HL sequence
Trade: LONG at HL
DOWNTREND
LL + LH sequence
Trade: SHORT at LH
Pivots form on MAV slope changes. Label every pivot. Trade WITH the wave direction - HL entries in uptrends, LH entries in downtrends.
Overview
Slingshot Pro is your multi-timeframe confluence tool. It shows when LTF and HTF are aligned through candle fills - your final check before pulling the trigger.
"Slingshot Pro shows confluence across timeframes with candle fills. Check it as your last point of the confluence matrix before entering the trade. All estimates aligned = highest probability."
What It Does
- Combines MAV-E and MAV-HTF signals into one visual
- Colors candle fills based on alignment
- Shows LTF, Current TF, and HTF estimates
- Filters noise - no fill means mixed signals
When to Use
- After establishing HTF bias with MAV-HTF
- After identifying structure with MAV-T
- Before entering any trade
- As your final confluence confirmation
Candle Fills
Candle fill colors tell you instantly whether timeframes are aligned.
Fill Logic
When candles have no fill, timeframes are conflicting. Wait for alignment before taking any trades.
MTF Confluence
Slingshot Pro shows three timeframe estimates. When all three align, you have maximum confluence.
The Three Estimates
| Estimate | Description | Purpose |
|---|---|---|
| LTF | Lower timeframe signal | Entry timing |
| Current TF | Current chart timeframe | Setup confirmation |
| HTF | Higher timeframe signal | Directional bias |
Confluence Levels
Stack these with Slingshot Pro signals for highest probability:
Support/Resistance
Horizontal levels from previous pivots
Fibonacci Retracements
38.2%, 50%, 61.8% pullback levels
VWAP Levels
Volume-weighted average price
Pivot Confluence
Multiple pivots at same level
Settings
Slingshot Pro uses the same core MAV parameters. The candle fill logic is automatic based on slope alignment.
Default Configuration
Slingshot Pro inherits the MAV settings. No additional configuration is needed for the candle fill logic - it automatically detects MAV-E and MAV-HTF slope alignment.
Visual Options
- Fill Opacity: Adjust transparency of candle fills
- Show Estimates: Toggle visibility of LTF/CTF/HTF labels
- Color Scheme: Customize bullish/bearish colors
Overview
MAV RADAR is an automated scanner hosted on a dedicated server, accessed through Discord bot commands. It applies the MAV methodology to thousands of symbols across multiple asset classes.
Run RADAR scans directly in your browser at maverick-radar.org. Matrix Mav exposes all RADAR timeframes in one persistent dashboard — broader than the per-command Discord bot. No installation required.
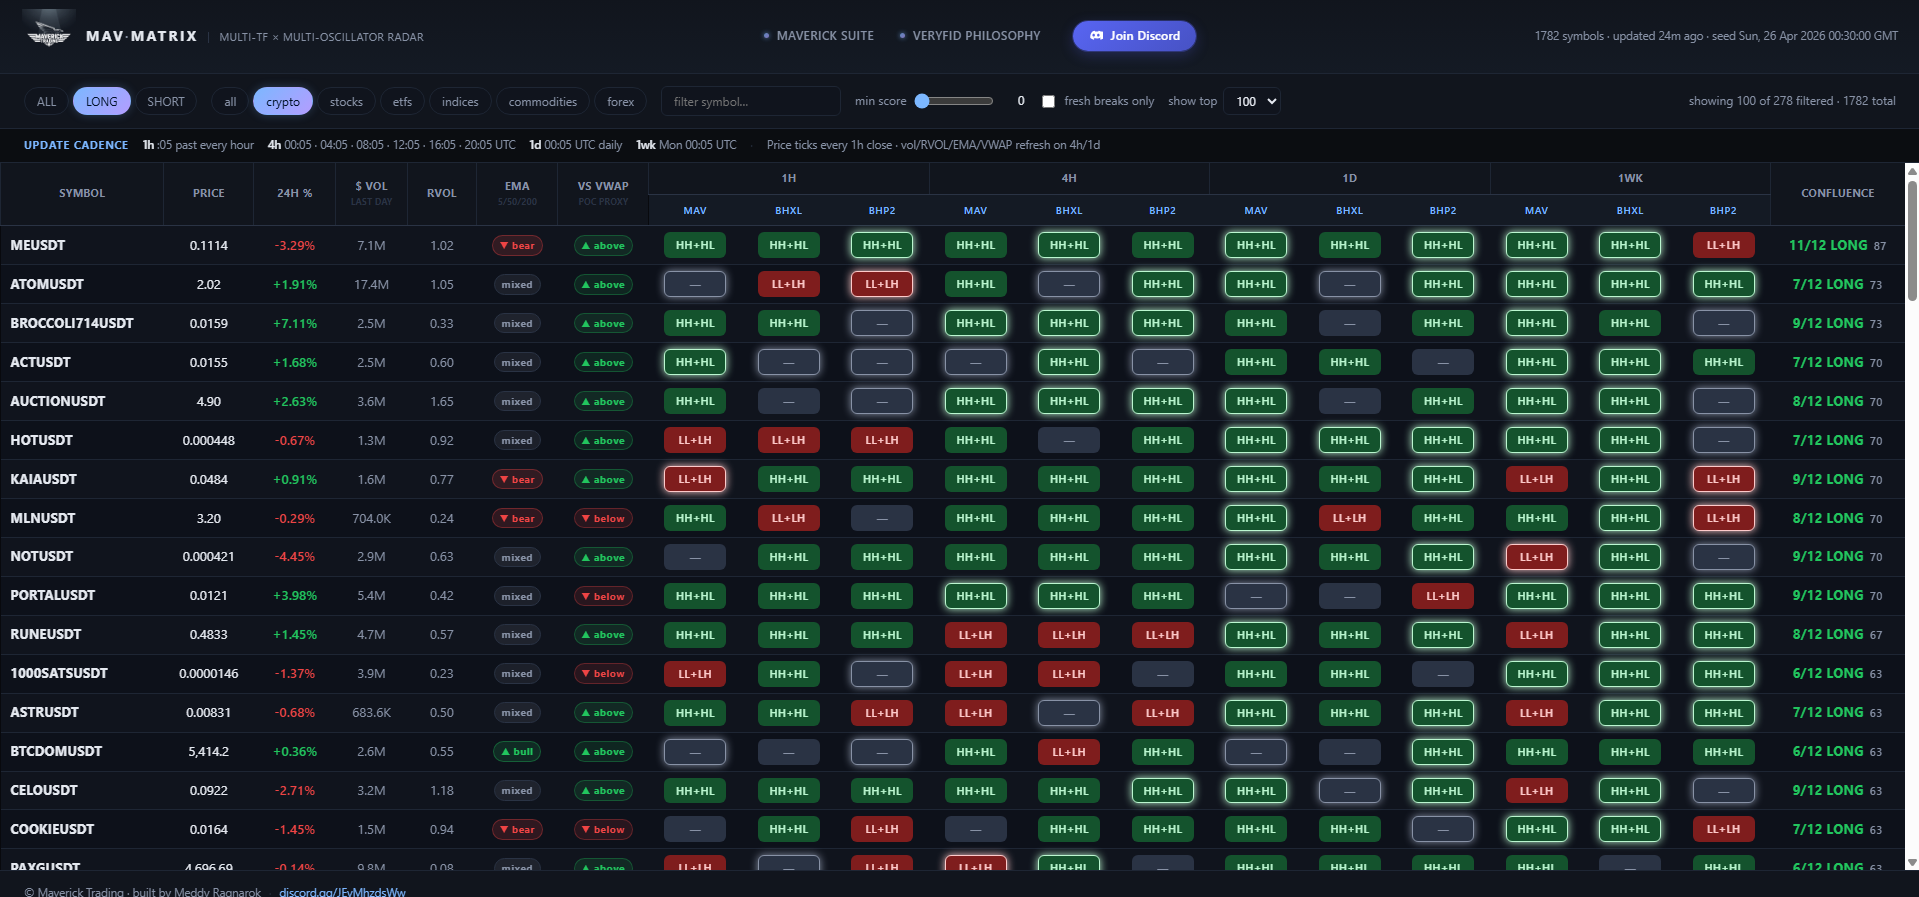
MAV-MATRIX dashboard at maverick-radar.org — all timeframes (1h / 4h / 1d / 1w) and oscillator combos in one persistent view, with live confluence scoring.
Capabilities
Multi-Asset
Scans stocks, crypto (Binance Futures), ETFs, commodities, indices, and forex.
Multi-Timeframe
Analyzes both LTF (scan) and HTF (context) for true MTF confluence scoring.
Pattern Detection
Identifies HH+HL sequences for longs, LL+LH sequences for shorts automatically.
Confluence Scoring
Scores 0-100 based on EMA alignment, volume, Fibs, AVWAP, divergences.
Output Types
- CSV: Full results for analysis
- HTML: Formatted interactive table
- Discord: Alerts with top candidates
- Charts: Auto-generated MAV charts for top 5 results
Scan Modes
MAV Mode (Default)
MAV Oscillator pivot detection. This is the recommended mode for clean structure analysis.
Uses proprietary MAV oscillator settings for pivot detection. Clean structure analysis with optimized parameters.
PRICE Mode
Pivot detection directly on raw price data. More sensitive, more signals. Use for aggressive scanning.
Detects pivots directly on raw price data. More sensitive with more signals - good for aggressive scanning.
Trade Directions
LONG
Scans for HH+HL sequences and bullish breaks above pivot highs.
SHORT
Scans for LL+LH sequences and bearish breaks below pivot lows.
MTF Scan
Multi-timeframe scan that analyzes LTF + HTF together, showing you the state matrix across both timeframes for true confluence.
Command Format
!mtfscan <oscillator> <ltf> <htf> <direction> <assets> <volume>Examples
!mtfscan MAV 4h 1d LONG crypto 100M
!mtfscan BHXL 4h 1wk LONG stocks,etfs
!mtfscan BHP2 1d 1wk SHORT crypto 50M
Valid Timeframe Combos
LTF must be lower than HTF:
- 4h + 1d - Intraday entries with daily bias
- 4h + 1wk - Intraday entries with weekly bias
- 1d + 1wk - Daily entries with weekly bias
Signal Strength
MTF Scan ranks signals from strongest to weakest:
| Strength | Signal Type | Meaning |
|---|---|---|
| +++++ | Multi-TF Breakout | Both LTF and HTF breaking together |
| ++++ | HTF Alignment / LTF Pullback | HTF trending, LTF pullback entry |
| +++ | Dual Structure / Single TF | Both building or one TF only |
| ++ | Counter-trend / HTF Pullback | Against HTF or HTF retracing |
| + | Deep Pullback | Single TF retrace only |
Trinity Scan
The ultimate 3-timeframe scan. LTF for entries, MTF for structure, and Bias TF for directional filter. Only shows results where the bias slope confirms direction.
Trinity Scan automatically filters results by the Bias TF pivot slope. LONG scans require positive slope (uptrend). SHORT scans require negative slope (downtrend).
Command Format
!trinityscan <oscillator> <ltf> <mtf> <bias> <direction> <assets> <volume>Examples
!trinityscan MAV 4h 1d 1wk LONG stocks,etfs
!trinityscan BHXL 4h 1d 1wk LONG crypto
!trinityscan BHP2 1h 4h 1d SHORT stocks,crypto 50M
Valid Timeframe Combos
Must be in order: LTF < MTF < Bias
- 1h + 4h + 1d - Scalp entries, intraday structure, daily bias
- 1h + 4h + 1wk - Scalp entries, intraday structure, weekly bias
- 4h + 1d + 1wk - Swing entries, daily structure, weekly bias
The Trinity Framework
Bias TF (1wk)
Directional filter. Slope must confirm trade direction.
MTF (1d)
Structure analysis. Pivot sequences and breaks.
LTF (4h)
Entry timing. Precise pullback entries.
Charts Output
Trinity Scan generates 9 charts for the top 3 results - each result gets a chart on all 3 timeframes for complete visual confirmation.
Scoring System
Each symbol receives a score from 0-100 based on multiple confluence factors.
Scoring Factors
| Factor | Description |
|---|---|
| Pattern Strength | Quality of pivot sequence and break status |
| EMA Alignment | 5, 50, 200 EMA positioning and slopes |
| Relative Volume | Current volume vs average (RVOL) |
| Fibonacci Levels | Proximity to key retracement levels |
| AVWAP/POC | Position relative to anchored VWAP and POC |
| Divergences | RSI, MACD, Stochastic, CCI divergences |
| Relative Strength | Performance vs SPY and sector (stocks only) |
Behavior Stages
RADAR classifies each symbol into a behavior stage:
Building Structure
Forming pivot sequence, no break yet
Fresh Break
Just broke a pivot level
Retracing
Pulling back after a break
Discord Commands
MAV RADAR is accessed entirely through Discord. Join the server and use bot commands to run scans and receive results.
Available Commands
| Command | Description |
|---|---|
!scan |
Run single-timeframe scan |
!mtfscan |
Multi-timeframe scan (LTF + HTF) |
!trinityscan |
3-timeframe scan with bias filter (LTF + MTF + Bias) |
!status |
Check running scan status |
!cancel |
Cancel your running scan |
POC Ghost Levels Pro
A volume-based POC indicator built on Steidlmayer's Market Profile. Naked POCs act as price magnets — institutions defend the levels where they accumulated.
This indicator is for educational and informational purposes only. It is NOT investment advice, financial advice, trading advice, or a recommendation to buy or sell any security or financial instrument.
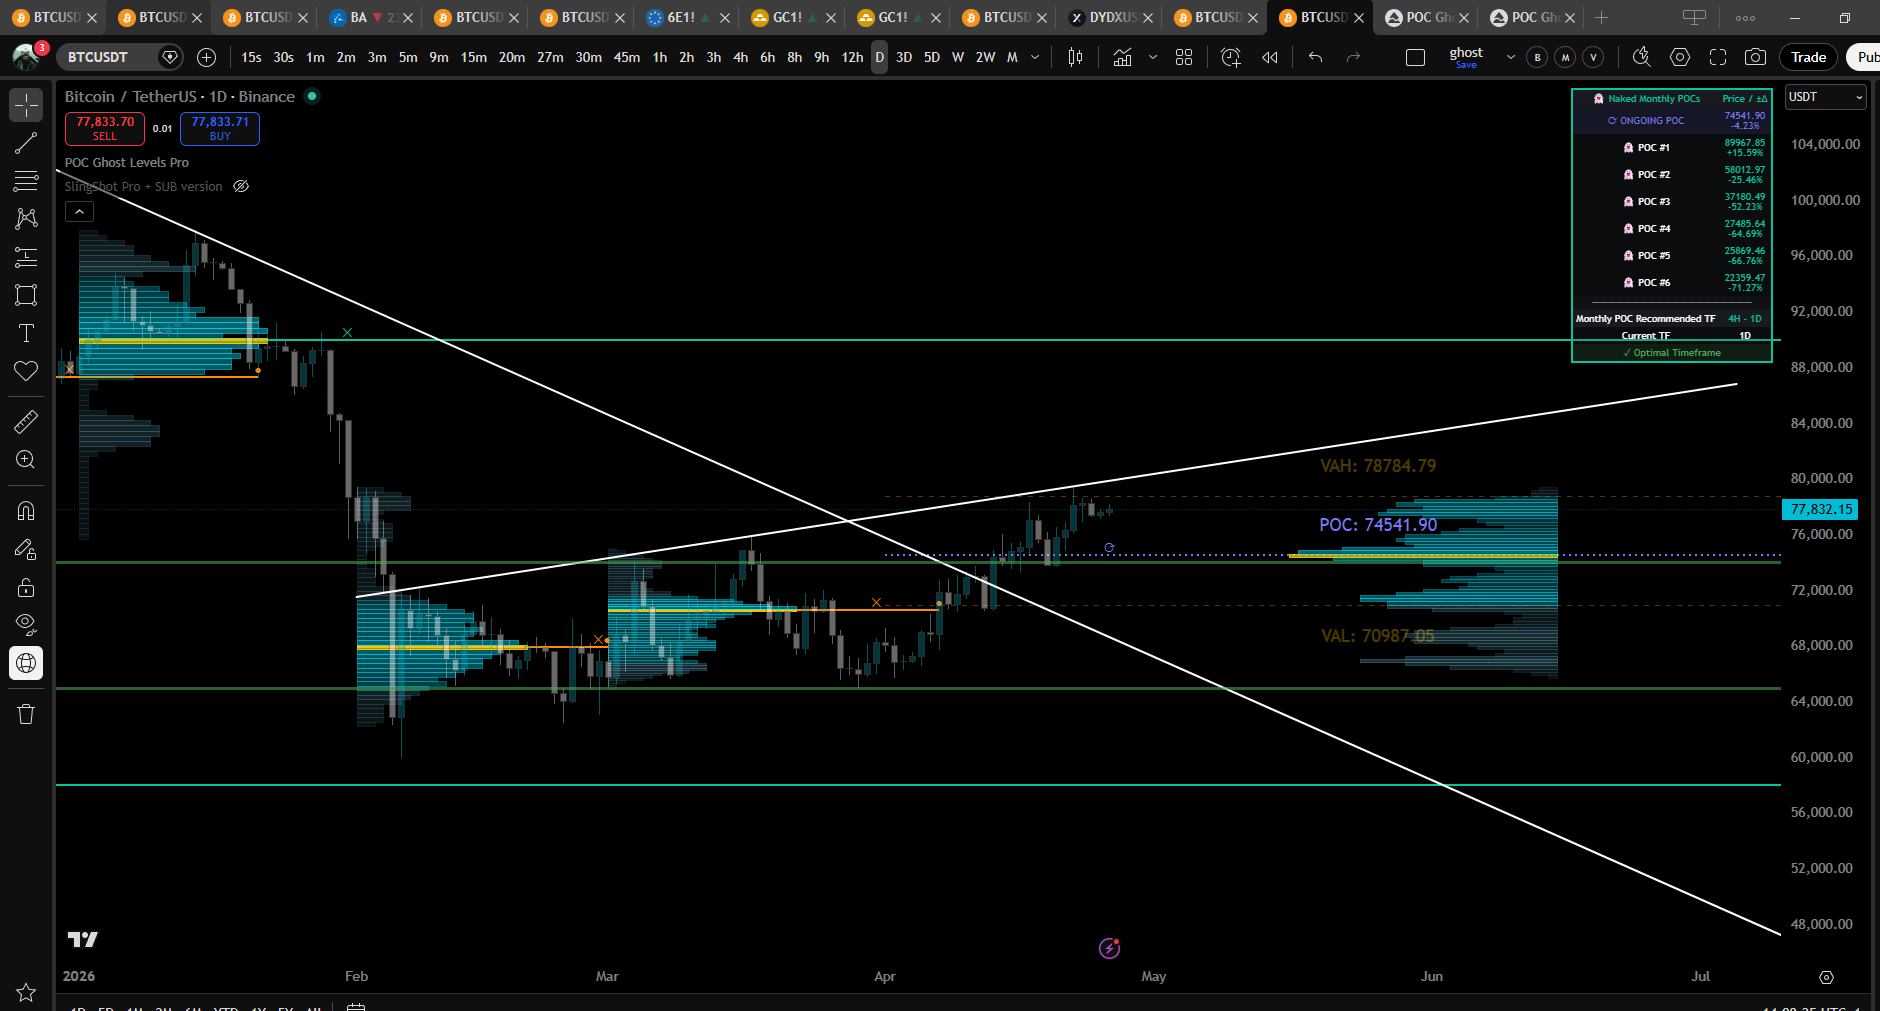
POC Ghost Levels Pro on BTCUSDT Daily — Naked Monthly POCs (👻), Ongoing POC (⟳), Value Area, and current-period Volume Profile.
What is Point of Control?
Point of Control (POC) is the price level with the highest traded volume within a period. The concept was developed by J. Peter Steidlmayer at the Chicago Board of Trade (1981–1983) as part of Market Profile theory.
POC reveals where institutional traders accumulated their largest positions. These levels act as strong support/resistance because institutions defend them — a POC is where the market said "this is fair price" and traded the most contracts.
A "Naked POC" is a POC that price has not returned to since the period closed. Naked POCs are statistically stronger attractors than already-tested POCs — gravity increases as price approaches.
Visual Elements
Each marker on the chart has a specific meaning. Reading them correctly is half the edge.
| Element | Meaning | What It Tells You |
|---|---|---|
| Teal POC line | Active Naked POC | Untouched institutional accumulation zone — high-probability magnet |
| Orange POC line | Mitigated POC | Already revisited; weaker but still relevant historical reference |
| ✕ Symbol | Period End | Marks when the POC's calculation period closed (D / W / M / Y) |
| ● Dot | Mitigation Point | Bar where price first revisited the POC (high ≥ POC ≥ low) |
| ⟳ Symbol | Ongoing POC | Live POC for the current (incomplete) period — updates each tick |
| 👻 Naked badge | Untouched since formation | POC has never been kissed since its period closed — strongest pull |
| "2nd" label | Secondary POC | Second-highest volume bin in the current period — backup level |
| VAH / VAL lines | Value Area High / Low | Boundaries containing 67% of the period's volume |
The Ghost Effect
Extended POC lines represent market memory. Even after a period closes, the POC remains on the chart as a horizontal level. Price gravitates toward these levels in the future — they represent the "fair price" where most volume traded, and the market keeps coming back to test them.
Trading Theory
All markets are auction processes seeking to maximize volume. POCs reveal where the auction settled.
Auction Market Theory
Volume is the truest indicator of the market's ability to facilitate trade. Markets that fail to facilitate trade at a given price will move to levels that better facilitate it. The POC is, by definition, the price where the market facilitated the most trade — therefore it represents the fairest price the market discovered during that period.
Why Institutions Defend POCs
Big institutions cannot enter positions instantly — a $500M position takes hours or days to fill without moving the market. They accumulate over time, and the POC reveals where those positions formed. When price returns to that level, those institutions defend their average entry — creating reliable bounces.
First Test = Highest Probability
Trade the first POC test (the mitigation) for highest-probability setups. Subsequent tests weaken as the level loses its "naked" status.
Trending Markets
POCs confirm trend legs. A trend that holds above prior-period POCs is healthy; failure to hold them signals exhaustion.
Ranging Markets
POCs act as central magnets. Price oscillates around the POC; fades from the edges back toward POC are high-probability.
Multi-Period Confluence
When a Monthly POC, Weekly POC, and Daily POC stack within a tight range, the level becomes a near-certain reaction zone.
Pro+ Features
What makes the Pro+ version more accurate than free POC scripts and even TradingView's native Volume Profile.
Volume Distribution Math
Most POC indicators distribute each bar's volume evenly across the bins it touches (equal-split). This is mathematically inconsistent — a tight bar and a wide bar covering the same number of bins get the same per-bin weight, even though they represent vastly different price ranges.
| Method | How It Works | Accuracy |
|---|---|---|
| LTF Closes (default) | Pulls actual sub-bar candles via request.security_lower_tf and distributes each LTF bar's volume across its own H–L range |
Highest — uses observed intrabar behavior |
| Hi-Lo Proportional | Per-bin volume = bar volume × (bin width / bar range). Standard Market Profile math. | Correct theoretical model — assumes uniform distribution |
| Equal-split (free scripts) | Per-bin volume = bar volume / bins touched | Lowest — ignores bar range proportions |
What's in Pro+
Naked POC Tracking
- 👻 Naked label per untouched POC
- Approach alerts (price within X% of POC)
- Mitigation alerts (first kiss)
- ±Distance column in POC table
Real-Time Levels
- Ongoing POC (live, current period)
- Secondary POC (2nd-highest bin)
- Value Area (VAH / VAL)
- Configurable VA % (default 67%)
Volume Profile Render
- Current period + N past periods
- Gold POC bin highlight
- VA-tinted vs. outside-VA bins
- Smart-scaled width per period
Safety
- TF guardrail table
- Bar-index error warnings
- Auto-fallback past LTF cap
- No fake order-flow features
Combo Signal
When an Ongoing POC enters approach distance of a Naked POC from a higher timeframe, treat it as a high-probability test zone.
Stacking with Maverick Suite
- Ghost Levels identifies the level (POC test zone)
- MAV-HTF tells you the bias (long-only or short-only)
- MAV-E times the entry (pivot + divergence)
- Slingshot Pro confirms the alignment (candle fill)
Confluence Detector Coming Soon
A companion indicator that will read up to 3 Ghost Levels Pro+ instances and flag clusters where Monthly + Weekly + Daily POCs stack together.
The Ghost Confluence Detector is in development and not yet available on TradingView. The documentation below previews how it will work once published. Pro+ already exposes the companion plots needed to feed it.
Planned Setup
Add Pro+ three times
One instance per period — Monthly, Weekly, Daily. Rename each on the chart so you can tell them apart in the source dropdown.
Add the Confluence Detector
Once released, search "Ghost Confluence Detector" in TradingView indicators.
Map sources per slot
For each Slot, set "Ongoing POC source" → Pro+ Companion: Ongoing POC plot, and "Naked POC source" → Pro+ Companion: Naked POC #1 plot.
Tune threshold
Default 0.5% will cluster POCs within half a percent of each other. Tighter for index futures, looser for crypto.
Key Literature
The theory behind POC and Market Profile. These are the source texts.
- Steidlmayer, J.P. & Hawkins, S.B. (2003). Steidlmayer on Markets: Trading with Market Profile (2nd ed.). Wiley.
- Dalton, J.F., Jones, E.T., & Dalton, R.B. (2012). Mind Over Markets: Power Trading with Market Generated Information. Wiley.
- Dalton, J.F., Dalton, R.B., & Jones, E.T. (2007). Markets in Profile: Profiting from the Auction Process. Wiley.
- Jardine, M. (2012). Just a Trade a Day: Simple Ways to Profit from Predictable Market Moves. Wiley Trading.
Dow Theory
The foundational framework for understanding trends. MAV is built on these timeless principles.
Trends Persist Until Reversal
A trend in motion stays in motion. Don't anticipate reversals - wait for confirmation. This is why we trade continuations, not reversals.
Higher Highs, Higher Lows
Uptrend = HH + HL sequence. Downtrend = LL + LH sequence. When this sequence breaks, the trend may be exhausted.
Trends Have Three Phases
Accumulation (smart money), public participation (the trend), distribution (smart money exits). We trade the middle phase.
Volume Confirms Trend
Strong moves should have volume expansion. Weak moves on low volume are setups forming.
Center of Gravity
John Ehlers' COG indicator is the mathematical foundation of MAV. It finds the balance point of price with minimal lag.
Why COG?
Zero Lag
Unlike moving averages that lag behind price, COG identifies the current center point of price action.
Smooth Output
Despite zero lag, COG produces a smooth line suitable for structure analysis and pivot detection.
No Bounds
No artificial 0-100 range. Price can trend indefinitely without hitting "overbought" or "oversold."
"The primary advantage of the MAV Oscillator is precisely its lack of upper and lower limits, which allows for a more accurate and realistic analysis of market structures."
MTF Analysis
Multi-timeframe analysis is how professionals trade. The slower TF filters noise, the faster TF provides entries.
The Hierarchy
HTF - Bias
Daily/Weekly defines direction. MAV-HTF slope tells you: LONG or SHORT only.
Structure TF
4H/Daily maps the channel. MAV-T shows pivot sequences and breakout levels.
Entry TF
1H/4H times entries. MAV-E + Slingshot Pro for precise entry at HL (longs) or LH (shorts).
"The smaller waves, the setup waves, are the micro 'legs' within macro waves. Setups allow you to trade within the larger legs of the macro trend."
Entry Types
Not all pivots are equal. Context determines whether a pivot is a high-probability entry or noise.
Random Pivot vs Pullback Entry
"Technically a Pullback Long and a Bullish Pivot are the same thing - both are 'a Higher Low being detected'. The difference is the point in the sequence where they take place."
Random Pivot
Can occur almost anywhere without meaning too much. No context = weak signal.
Pullback Entry
A pivot that prints after breaking something - median, Donchian, SR level. Context = strong signal.
What Counts as "Breaking Something"
- Static Median: The green/red centerline
- Dynamic Median: The moving median line
- Donchian Channels: Hidden background levels
- SR / Fibs / VWAP: Key confluence levels
The ideal sequence: Price breaks a level → Tests/retests the level → Entry on the pullback pivot. This is the highest probability setup.